
Follow the evidence
Bring metrics, incidents, available logs and dependency context into an investigation. Review supporting and conflicting signals before deciding what to check next.
Infrastructure monitoring and operational intelligence
Monitor performance across your sites, understand unusual behavior, and bring the right evidence together when something needs attention.
The overview connects sites, observed health and current attention. Unknown or missing coverage stays visible.
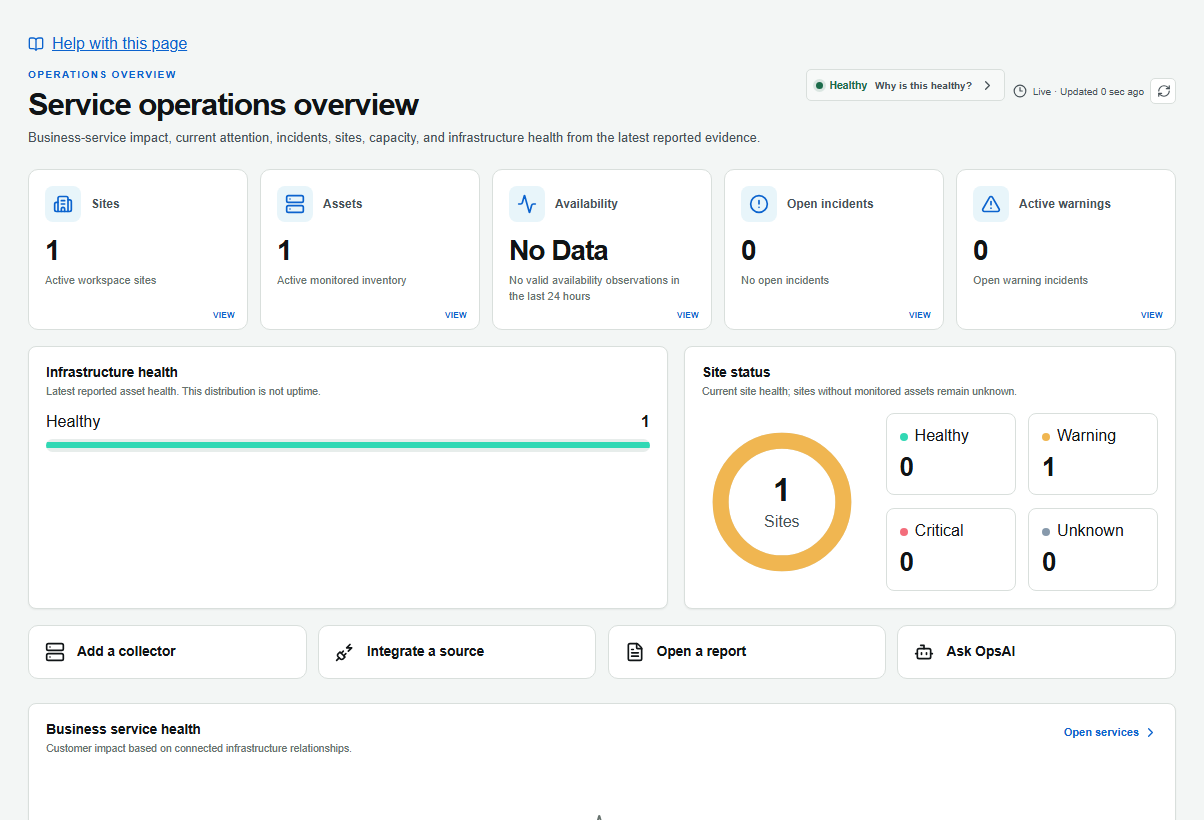
Actual staging application · controlled test workspace · September 2026. Open the image to inspect the interface at full size. This is not customer performance data.
Report categories organize the available evidence. The selected period and data coverage determine what a report can establish.
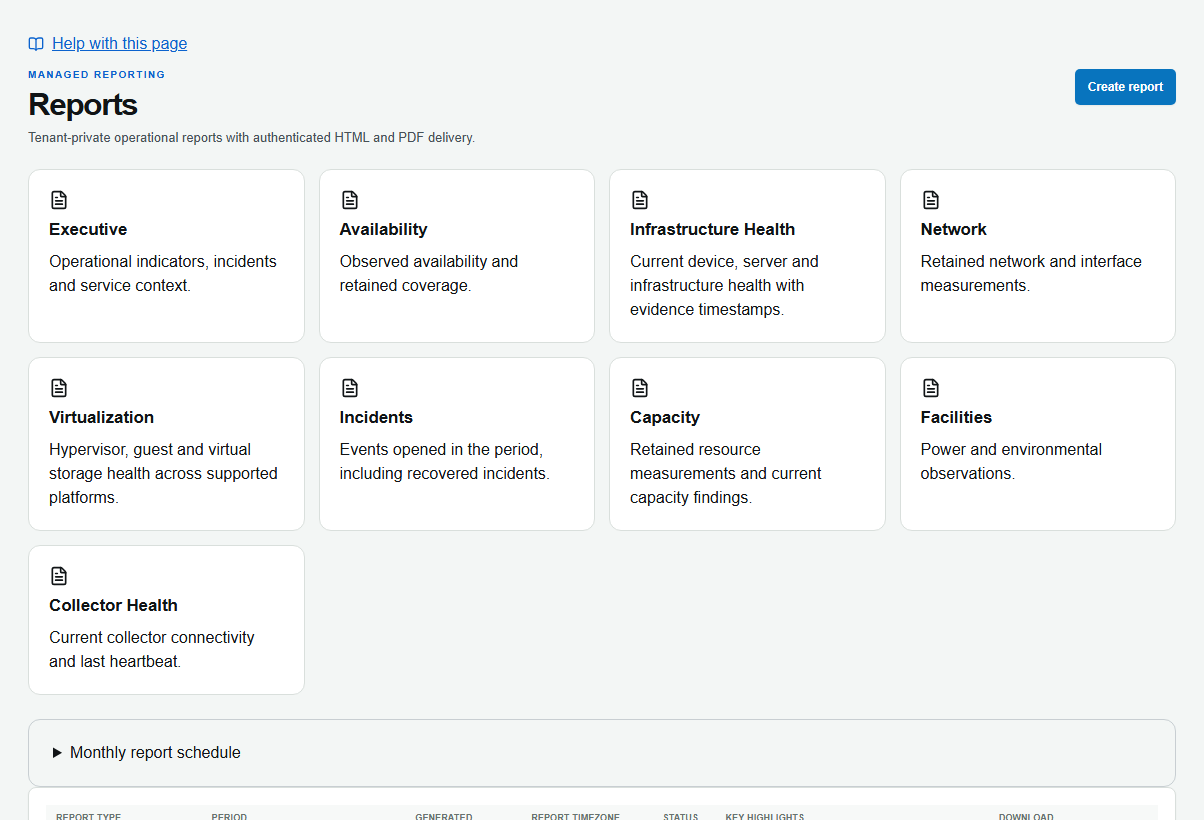
Actual staging application · controlled test workspace · September 2026. Open the image to inspect the interface at full size. This is not customer performance data.
Site Edge collects from authorized private sources and sends evidence outward to your workspace. Hosted collection checks approved public endpoints. Available measurements depend on the source and its permissions.
Monitor → Investigate → Report
Scoped access. Read-only collection. Evidence in context.Select the workspace and site that will own the collector.
Use the approved signed installer and the setup instructions for your platform.
Wait for a live heartbeat, applied configuration and required capabilities.
Review discovered resources, choose the supported scope and explicitly enable monitoring.
Pairing assigns the collector. Ready confirms that it can collect. You decide which supported resources to monitor.
Bring metrics, incidents, available logs and dependency context into an investigation. Review supporting and conflicting signals before deciding what to check next.
Compare behavior and capacity trends where enough history exists. Missing coverage and uncertain forecasts remain visible.
Connect private sources through a securely enrolled Site Edge. Follow the collector responsible for each source and see when its information was last updated.
Start with service health, current incidents, capacity findings and collection freshness.
Use reports with observed coverage and explicit periods. Operational detail, hourly history and daily summaries stay distinct.
Keep workspace access tied to invitations, MFA and explicit roles. Branding and commercial ownership do not replace authorization.
Plan an AIOps evaluation around a question your Philippine IT team needs to answer, then confirm the collection path and available measurements.
Available telemetry depends on the device, API, permissions and monitoring profile. Guest operating-system or hardware detail may need an additional source. Predictive views need sufficient history. Full raw-log archiving and custom integrations are separately scoped.